
If you haven't the faintest idea what I'm talking about -- a forgiveable oversight :) -- here's an earlier blog post that explains the Dividend Compass and how it works.
Also, a special thank you to those of you who have provided valuable feedback on the Dividend Compass -- in particular to Pablo, who noticed a broken formula that has since been fixed.
Since we're nearly finished with 2012 (hard to believe!), I've added a column for trailing-twelve month (TTM) figures so the data is as fresh as possible.
Roll up our sleeves
Today, I'd like to illustrate a few ways in which you can use the Dividend Compass to notice trends in dividend health and growth potential.
Here's how the Dividend Compass results tab looks today:
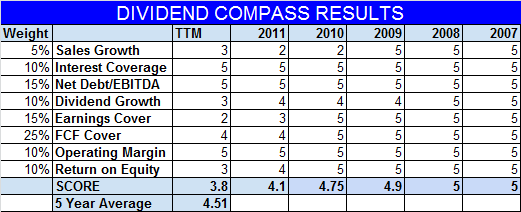
Setting aside the weights and final score aside for a moment and focusing on the line items, we can quickly recognize a few trends.
On the positive side, operating margins remain solid, the balance sheet (based on interest coverage and net debt/EBITDA) remains in excellent shape, and the dividend looks sustainable on a free cash flow cover basis.
Unfortunately, the negative trends appear to outweigh the positives. Sales growth, dividend growth, earnings cover, and return on equity have all declined by at least two full Dividend Compass points since 2008.
Devil in the details
A glance at the results that feed into the Dividend Compass confirms these trends:
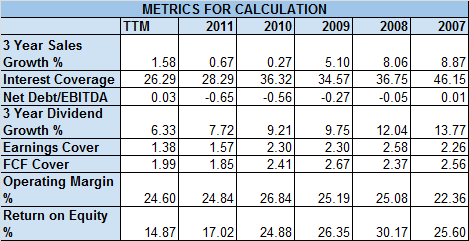
Recognizing these trends helps us focus our research. The negatives may or may not be as bad as they seem, but we do need to dig a little deeper to determine if the trends are genuine concerns.
On the slowing sales growth issue, JNJ has been adversely impacted by a few drug patent expirations, but relative to other major drug producers facing patent cliffs, JNJ's top-line isn't all that bad. JNJ's top-line has also been supported by consumer healthcare and medical device businesses. Still, the slowing growth is an issue to consider.
The declining earnings cover and ROE issues are linked as both metrics have been driven lower by the substantial litigation, product recall, and write-down expenses the company has taken over the past two years.
Excluding "one-time" charges like these, management expects 2012 adjusted EPS to be $5.05-$5.10 per share, which would equate to dividend cover near 2.1 times and implies an adjusted ROE of approximately 22-23%. In this light, things don't look quite as bad as the Dividend Compass score might suggest as the data is based on reported results and not adjusted results.
There's reason to believe that these expenses won't be recurring items, but the substantial charges have nevertheless impacted results as evidenced by slowing dividend growth and JNJ's relative under-performance over the period -- since the end of 2008, JNJ's share price has trailed the S&P 500 by 34 percentage points (SPY: +69.5%; JNJ: +35%).
However you view them, these one-time expenses matter and should be fully considered.
Bottom line
Whether or not you think there's cause for concern in this particular case, the Dividend Compass has helped us identify trends that required our attention. In some cases, we may find there's not a good explanation for the trends we see and that could be a sign to stay away or sell an existing position.
Hope you're having a great weekend and thanks for reading!
Best,
Todd
@toddwenning on Twitter
*This is not meant to be a full analysis of Johnson & Johnson nor is it an endorsement of the stock, but is meant to illustrate how the Dividend Compass can be used in your regular research. Further research is always necessary.